How to create 2-d charts using Html5 Canvas and CSS elements
If one opens a new website and wants to include some information related graphics, beautiful animation, image related processing, or games one should try learning about the HTML5 canvas element, an instant drawing surface utility in our very own webpage where one can make real time produced graphics, containing animations, videos, games, and all made without the use of a plug-in.
Using JavaScript one can interact with canvas. HTML5 basically adds a number of dominant graphic approaches to the JavaScript API. There are various methods used by JavaScript for drawing curved paths, text, lines and shapes. JavaScript is also used for interpreting images such as PNGs, JPEGs, JPGs, GIFs, and also videos. There are some JavaScript approaches for controlling canvas pixels in a direct way, and it also supports immediate image processing.
The canvas element provides a fast and a sophisticated answer for creation of interactive animations, graphics and 2D games. One can adjust canvas animations rapidly by using a text editor or text output from a script because they are written in HTML, CSS, and JavaScript. As no plug-in is desired, games and animations which are written by making use of canvas readily run on iOS powered devices and also on a desktop PC. Since the graphics are produced in real time basis on the operator’s system, they’re constantly updated and produce no load on the server or delay in the round trip.
The canvas requirement also provides for fallback which is simple, so one can start using canvas instantly while making sure to keep your website well-suited with old browsers. Canvas is supported in other current browsers and also on the desktop Mac OS X and Windows.
Canvas also supports transformation matrix i.e. whatever one draws can be converted, revolved, scaled and more.
Below are the main characteristics of the canvas, which comes along with the methods and properties on how to use and implement them.
- One can add elements of Canvas by using a few lines of code
- It’s very easy to Include various formats of images like JPEGs, JPGs, GIFs and PNGs
- There are approaches for drawing various shapes like Rectangles, Arcs , Lines and Curves and also very Intricate Shapes
- One Can use Canvas to render text
- Using Canvas one can produce rapid, frivolous animations
- One can maneuver pixels for processing of Images
- Making games that are playable on the PC and iOS, Android Based Devices
HTML5 Canvas Element:
- One of the utmost important fundamentals presented by HTML5 is the element of canvas. It generates a 2d Canvas (API) i.e. Application Programming Interface.
- By using JavaScript on this 2D resolution reliant on canvas which is basically a bitmap we draw animations, graphics and charts etc. on the real time basis.
- The defaulting size of the canvas is 300*150 (width multiplied by length). Though, one can outline custom extent and other characteristics for the canvas elements.
HTML5 Canvas Element browser support:
The canvas elements are sustained on all modern variants of all key browsers.
Compatible browsers include IE, Safari, Firefox, Opera, and Chrome etc. IE 9 supports HTML5 canvas elements but previous versions don’t.
Create a 2d Canvas:
We must always think of a Canvas as a 2D paper sheet on which we can precisely draw lines, graphics, shapes etc.
- The Canvas element will only produce bare canvas or a container, the part pertaining to graphics will be done by the JavaScript.
- We must create a markup for canvas with 3 characteristics Id, Width, and Height.
- Id: This attribute assigns a distinctive Id to the canvas element, by using this Id JavaScript will extract the graphics.
- Width and Height: It defines the measurements of the canvas.
- The canvas is primarily blank, without any borders and clear. One can use CSS background along with color and border attributes to describe the background and border correspondingly.
- One must always define the Height and Width through canvas characteristics and not by CSS.
Syntax: Canvas Element
|
1 |
<Canvas Id= "Unique_Id" Width="X px" Height="Y px"></Canvas> |
Canvas Context Object
- Once we have created a Canvas, our next task is to draw on it, for that we want a context object which will help us to sketch graphics on the canvas.
- The Canvas element’s provisions are intended to hold both 2D and 3D context of drawing. At present support is accessible for 2D context only, 3D context are in a very nascent stage but will be accessible in the imminent future.
Syntax: Context Object
|
1 2 3 4 5 |
<script> var Canvas = document.getElementById ('Canvas_Id'); var Context = canvas.getContext('2d'); var Context = document.getElementById('Canvas_Id').getContext('2d'); </script> |
Canvas Lines: lineTo (x, y)
The procedure of line drawing on a bitmap Canvas is comparable to that on a regular paper.
- We must indicate the start of a fresh path by using the method of begin-Path ().
- We then call the cursor used for drawing to the initial point of the sub path by using the method move-To(x, y).
- We then draw a straightforward line from the initial point to the stated co-ordinates by using the method lineTo(x, y).
- Lastly, we make the line noticeable by drawing its framework by using the method stroke ().
Line Width: lineWidth
The line in the below instance was thin, but we can describe the line width by stipulating the context’s lineWidth
E.g:- context.lineWidth= 7;
Line Color: strokeStyle
The by default shade of line using stroke() is black. Though that can be changed using the strokeStyle property.
E.g:- context.strokeStyle= ‘#fa4b2a’;
Example: Drawing a simple line on canvas with strokeStyle property
|
1 2 3 4 5 6 7 8 9 10 11 12 13 14 15 16 |
<Html> <Head> <Style> Canvas {Border:2px Solid #fa4b2a;} </Style> </Head> <Body> <Canvas Id="Canvas" Width="700" Height="300"></Canvas> <Script> Var Canvas = document.getElementById('Canvas'); VarContext = canvas.getContext('2D'); context.font = 'Bold 36pt Calibri, Arial’; context.fillText ('Html5 Canvas',200, 200); </Script> </Body> </Html> |
Canvas Line Cap: lineCap
- The line drawn in the above instances has a flat end.
- The Canvas element’s conditions are intended to hold both 2D and 3D drawing context. Presently support is accessible for 2D context only; 3D context is in very nascent stage but will be accessible in the imminent future.
Using CSS elements for Bar Graphs:
The concept is very simple which utilizes the percentage size abilities of CSS to precisely depict a % bar graph.
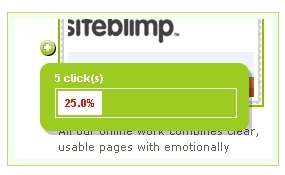
COMPLEX CSS BAR GRAPH
This is a more intricate visualization but still it follows the identical elementary idea. Here the chart is a ‘bad’ to ‘good’ pointer with an indicator that actions the distance of the color pattern. A nimbler bar shade also directs the marker position as it actions from left to right.
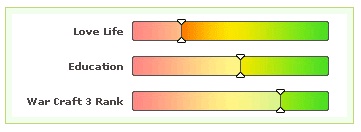
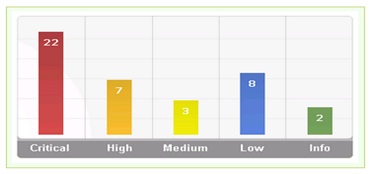
VERTICAL CSS BAR GRAPH
In this third example, we use the identical principle perpendicularly and replicate it numerous times to produce a more multifaceted graph. This specific explanation is one wherein one had to do was computed percentages, and the expression of the chart was superior to their stock graphing module.
Creating Pie Charts with CSS
After working around and creating bar charts with CSS elements, using same methods one can generate Pie charts. Keep in mind that this method is presently cutting-edge. It only works in the up-to-date versions of Firefox, Google Chrome, and Safari and Opera; and needs specific browser extensions to CSS to work, but also uses elements in the present CSS condition, so it positions that finally the rest of the network will catch up.
First of all, one must need to draw a circle, which is very easy to draw, it can be simply be created by using a square <div> and then set border radius to be half of its height/width
|
1 2 3 4 5 6 7 8 9 |
circle { position:absolute; background-color:red; width:300px; height:300px; moz-border-radius:200px; webkit-border-radius:200px; border-radius:200px; } |
Next, we have to divide that in half. Usually, one would merely sketch a half circle:
|
1 2 3 4 5 6 7 8 9 |
half-circle { position:absolute; background-color:red; width:200px; height:300px; moz-border-radius:300px 0 0 300px; webkit-border-radius:300px 0 0 300px; border-radius:200px 0 0 200px; } |
Nevertheless, this technique turn out to be difficult, subsequently we’ll have to rotate it. The half-circle which is above will rotate at its center (left-50, top-100). After we combine that with the alteration in width and length, it would need a horizontal shift to confirm the centers line up correctly. That’s a lot of mathematics or irritating trial and error. Luckily, there’s a cooler way. We can draw a full circle and use the old way of clip property to only show half:
|
1 2 3 4 5 6 7 8 9 |
Pie { position:absolute; width: 300px; height: 300px; clip:rect(0px,200px,300px,0px); moz-border-radius: 200px; webkit-border-radius: 200px; border-radius: 200px; } |
NOTE: One can use the unique half-circle method and set the CSS adjust origin property to right, center to change the rotation point. But research with this technique exposed that using adjust origin in browsers like Safari tend to neglect the radius across the border adjustment in Safari browser version 4.04 on Microsoft Windows. So while using this currently, stay with whole circle and cut.
At this instant we have a half circle that will revolve about the center of its flat edge. Next, we need to find a way to hide it in a way that permits us to show only the portion we want to see. So we take it into additional square
and clip it too, to show the differing half.
|
1 2 3 4 5 6 |
Hold { position: absolute; width: 300px; height: 300px; clip: rect(0px,300px,300px,200px); } |
We’re cutting the hold <div>, because we need it to revolve about the similar point as the circle. Now we load all the pie components on top of each other, and revolve the pie bits by their suitable percentage quantity — (360*(X*100)) where X is the % value — and also revolve each hold div the growingquantity of each preceding pie piece’s revolution. Below is the html code for the same:
|
1 2 3 4 5 6 7 8 9 |
<div id="Piece1" class="hold"> <div class="Pie"></div> </div> <div id="Piece3" class="hold"> <div class="Pie"></div> </div> <div id="Piece3" class="hold"> <div class="Pie"></div> </div> |
We can increase the subsequent CSS to generate a pie chart with 3identical pieces:
|
1 2 3 4 5 6 7 8 9 10 11 12 13 14 15 16 17 18 19 20 21 22 23 24 25 26 27 28 29 30 31 32 33 34 35 |
#piece1 { } #piece1 .pie { Color:red; moz-transform:rotate(115deg); webkit-transform:rotate(115deg); -o-transform:rotate(115deg); Transform:rotate(115deg); } #piece2 { moz-transform:rotate(115deg); webkit-transform:rotate(115deg); -o-transform:rotate(115deg); Transform:rotate(115deg); } #piece2 .pie { Color:green; moz-transform:rotate(115deg); webkit-transform:rotate(115deg); -o-transform:rotate(115deg); Transform:rotate(115deg); } #piece3 { moz-transform:rotate(230deg); webkit-transform:rotate(230deg); -o-transform:rotate(230deg); Transform:rotate(115deg); } #piece3 .pie { Color:blue; moz-transform:rotate(115deg); webkit-transform:rotate(115deg); -o-transform:rotate(115deg); Transform:rotate(115deg); } |
Now, the additional shrewd students will observe that this works fine for pie bits that are 50% of the pie or less. How can you sketch greater pieces? There are 2approaches. The easiest is to just sketch a whole circle and then overlap the other parts on top. But if you want a separate part that you can possibly transfer out for importance, you’ll want to do two stuffs: remove the cut on the hold <div>, and add an additional pie part as filler.
|
1 2 3 4 5 6 7 8 |
hold.gt50 { clip:rect(auto, auto, auto, auto); } Piefill { moz-transform:rotate(180deg); webkit-transform:rotate(180deg); Transform:rotate(180deg); } |
The Code in Action i.e. Output:
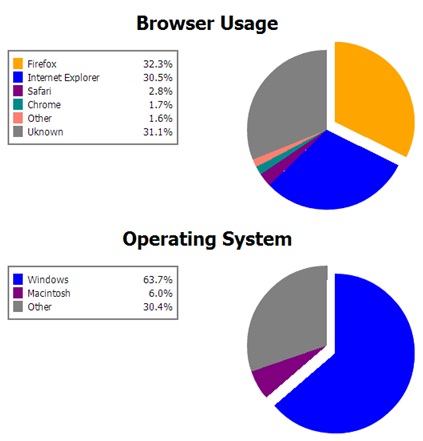
The 2 charts above are produced totally with CSS elements and contain no images.
Pure CSS Line Graph
Below is a solution for doing line graphs using nothing but simply using CSS.
Several will not see the ample logic in this technique, especially when we have so much JavaScript or even Flash built line graph scripts.
The purpose was not only to allow data conception to people that don’t feel happy with using plentiful scripting languages but also to exhibit the clout of CSS and provide a method of using CSS a bit in a different way. Below are certain methods to study a thing or two about CSS sprites and placing.
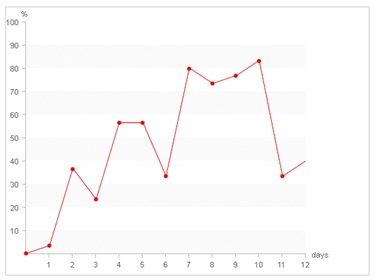
So, the line charts are decent for a simple thing that users probe your page; they don’t read every word and figure you write. Line charts will convey info much quicker than a table full with numbers.
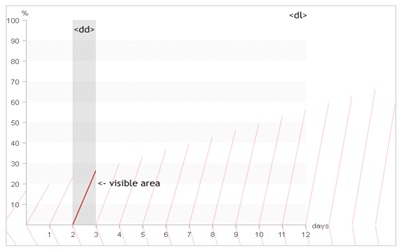
How does this thing work?
This method takes organized html, substitute text with pictures and by using css sprites and total positioning it produces an imitation of a line chart. DL component is fashioned to exemplify the coordinate method where we place items.
The measurements used in the background graphic describe the scopes we’re using for child components in demand for the whole thing to fit fine. In this case, every entry will signify one day. For objects we are using DD components with nested distances. We are constructing and assigning the DL’s so they form linear bars through the chart.
The fashioning of nested distances is what makes this css line chart likely.
The Graph Standard
In the above example item’s (DD’s) extents are 33px in thickness and 330px in height. Each one of those effects indicate one line travel from one pt. to the other pt. We therefore by use of a single image, CSS sprite that has all thinkable choices showed graphically. As one can comprehend on the image, there are outlines that go up and lines that go down.
But that is not all. We also have to set the “opening position” for everything as the lines always start at dissimilar values. That is completed by setting the upper value for every SPAN.
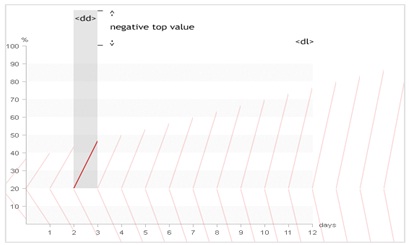
For this purpose, each SPAN has 2 class terms involved: one that describes the SPAN’s “opening point” and another that signify the increasing or decreasing “line move” (SPAN’s background point value). Initial point is built on preceding value. You have to carry on with following item where the preceding item “clogged”.
Conclusion:
The mixture of canvas features like sketching, scaling, revolving, interpreting and pixel modification, which along with the power and performance opportunity of using pre execution gives a range of controls to make unflappable, vibrant games. In short, the Canvas code is a meek component with huge abilities; you can add pictures, alter text, add gradients and do whatever connected to pixels with it in HTML5.
